Connection Circles
Understand
Think in systems.
In a city with rising childhood asthma, a public health team mapped key factors: air pollution, ER visits, missed school, parent stress, inhaler use, traffic, and outdoor play. They found air pollution triggered asthma attacks, increasing ER visits and parental stress. This stress, along with air quality concerns, reduced outdoor activity, lowering kids’ physical activity and harming their overall health.
Steps
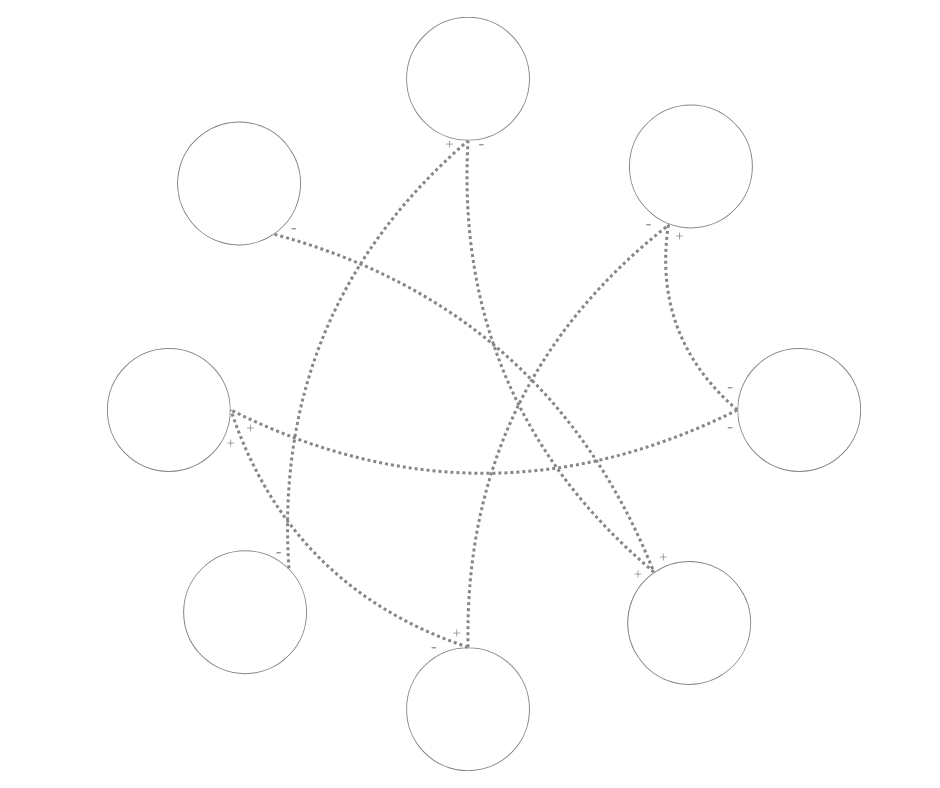
Draw a big circle. This is your workspace, where you’ll map out how different parts of the system (called elements) affect each other.
Choose up to 10 key elements. These are the important things in the system that change over time and influence each other. They could be trends, behaviors, or conditions. Avoid vague or overly broad concepts like “justice” unless they can be clearly defined. Spread these variables evenly around the edge of the circle.
Ask: If this variable goes up or down, does it make another variable go up or down later?
If yes, draw an arrow from the first variable (the cause) to the second one (the effect). Each arrow shows something that changes over time, not just a one-time thing.
If the first variable increases the second one, write a “+” on the arrow.
If it decreases the second one, write a “–”.
These signs don’t mean “good” or “bad”, just the direction of the change. Some effects take time to appear, so be sure to consider time delays. To show a delay, draw a short dash across the arrow.
Use your map to see hidden patterns in how things are connected; spot leverage points, places where a small change can make a big difference; and make better long-term decisions.
Based on the ideas of Peter Senge (1990) & Donella Meadows (1992).
Related Building Cards